part 3
Data Analysis
Introduction
In this session you will learn the basics of data management and analysis using Stata. The first part of the presentation will focus on combining datasets through the append and merge commands. Section two will introduce five commands to help you summarize and tabulate your data. The final part covers data export and how to automate routine tasks using loops.
Part 2 Goals
- combine datasets using append and merge
- summarize datasets across different dimensions using:
- summary
- tabulation
- table
- tabstat
- collapse
- export data for use in other programs (Excel, Tableau, R,…)
- automate tasks through loops
Key Stata functions for combining and summarizing data
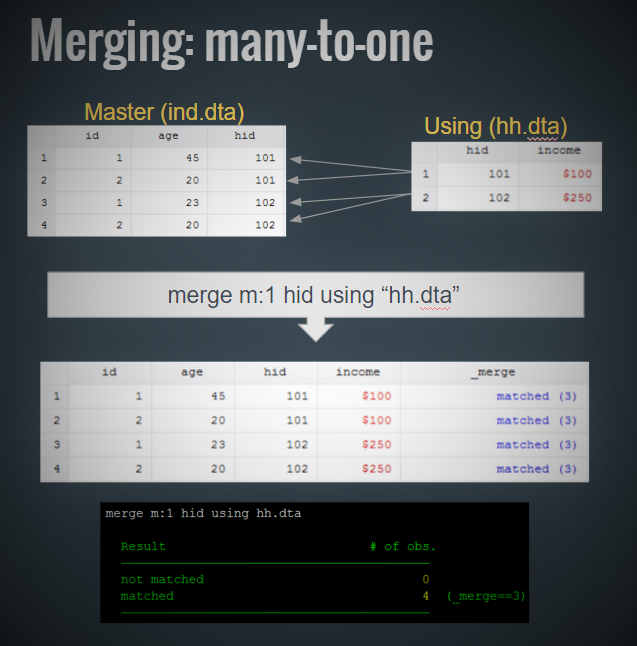
append: append to datasets togethermerge: merged datasets together using unique identifierssummarize: produce summary statisticstabulate: produce table of frequenciestable: produce flexible table of summary statisticstabstat: produce compact table of summary statisticscollapse: create dataset of summary statistics (modifies the dataframe)forvalues: loop over consecutive valuesforeach: loop over items
Exercises
- Exercise 1: Merge household data into individual data
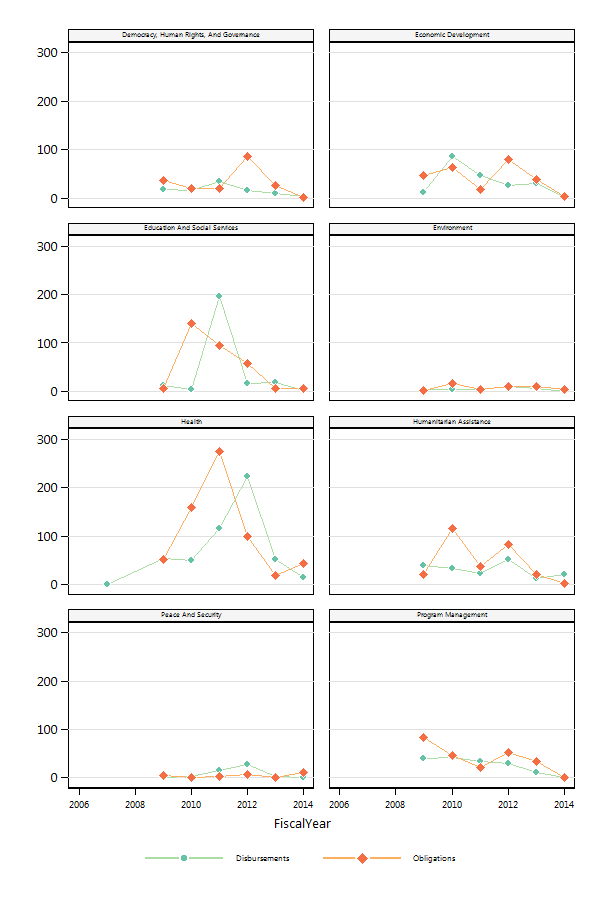
- Exercise 2: Collapse and summarizing foreign assistance data
- Exercise 3: Loop over household assets
- Exercise 4: Loop over geographic zones
- Exercise 5: Execute mathematical operations through loops

Up next…
Now that we have learned about the fundamentals of data munging, we will move on to some principles of data visualization.